
Description
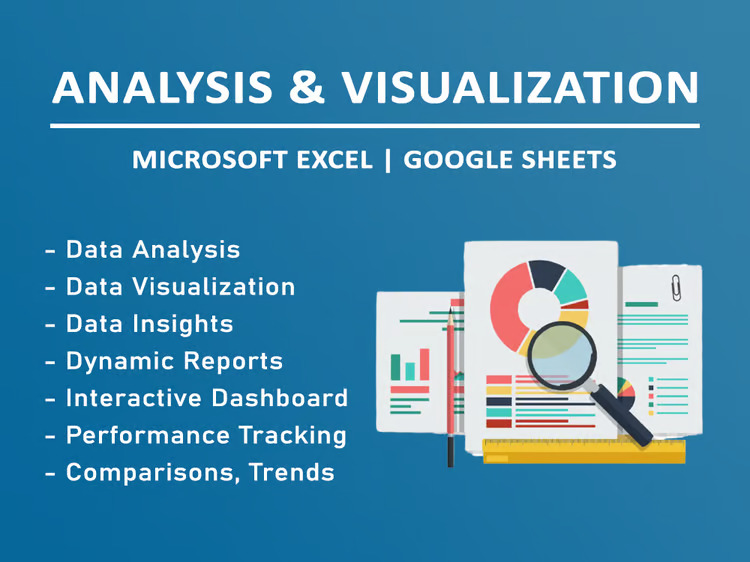
Data visualization, dashboards, graphs, charts, pivot tables, and data analysis are integral components of the broader field of data analytics. Here’s an overview of each:
- Data Visualization:
- Data visualization involves presenting data in graphical or pictorial formats to make it easier to understand, analyze, and interpret. Visualization can include charts, graphs, maps, and other visual elements that help convey complex information more intuitively.
- Dashboard:
- A dashboard is a visual display of key performance indicators (KPIs) and metrics that provide an at-a-glance overview of an organization’s or individual’s performance. Dashboards often consist of multiple widgets or visual components, such as charts and graphs, arranged on a single screen.
- Graphs and Charts:
- Graphs and charts are visual representations of data. They help convey trends, patterns, and relationships within the data. Common types of graphs and charts include bar charts, line charts, pie charts, scatter plots, and more. The choice of graph or chart depends on the nature of the data and the insights you want to communicate.
- Pivot Table:
- A pivot table is a data processing tool used in spreadsheet programs like Microsoft Excel or Google Sheets. It allows users to reorganize and summarize selected columns and rows of data into a more manageable format. Pivot tables are especially useful for aggregating and analyzing large datasets.
- Data Analysis:
- Data analysis involves examining, cleaning, transforming, and modeling data to discover useful information, draw conclusions, and support decision-making. Various statistical and computational techniques are employed in data analysis to extract meaningful insights from datasets.
In a business context, these tools and techniques are often used together. For example:
- A business might use data visualization tools to create interactive dashboards displaying key metrics such as sales performance, customer satisfaction, and marketing effectiveness.
- Within these dashboards, different types of graphs and charts can represent specific aspects of the data, providing a comprehensive view of performance.
- Pivot tables might be employed to analyze sales data, allowing users to quickly group and filter information based on different criteria.
- Data analysis techniques can be applied to identify trends, correlations, outliers, and other patterns in the data, helping businesses make informed decisions.

Hadiza –
Working with this freelance data visualization specialist was a fantastic experience. His proficiency in creating interactive dashboards, clear graphs, and charts brought our data to life. The freelancer’s expertise in pivot tables allowed for a comprehensive analysis of our datasets. The result was not just visually pleasing but also immensely valuable for our decision-making process.
Isa –
Choosing this freelance expert for data visualization and analysis was a game-changer for our business. His ability to create dynamic dashboards, visually appealing graphs, and insightful charts made complex data accessible and easy to interpret. The inclusion of pivot tables added another layer of depth to our analysis.
Elizabeth –
I can’t thank this freelance data visualization specialist enough for their exceptional work. His expertise in creating insightful dashboards, detailed graphs, and charts significantly enhanced our data analysis capabilities. The freelancer’s proficiency in pivot tables allowed us to derive valuable insights from our datasets.
Kabiru –
Working with this freelance data visualization expert was a delight. He transformed our raw data into meaningful insights through stunning dashboards, graphs, and charts. The attention to detail, coupled with his ability to create informative pivot tables, was truly commendable.
Victoria –
Absolutely impressed with the data visualization and analysis provided by this freelance expert. From creating insightful dashboards to crafting visually appealing graphs and charts, their skills are unmatched. The freelancer’s proficiency in pivot tables and data analysis made our complex datasets easy to understand. I highly recommend his services for anyone seeking a top-tier data visualization specialist.