Description
Data analysis and dashboard visualization in Excel and Google Sheets involve using these spreadsheet tools to analyze data, create visual representations, and present key insights in a dashboard format. Here’s an overview of the key concepts:
Data Analysis in Excel and Google Sheets:
1. Data Cleaning:
- Excel and Google Sheets provide tools for cleaning and organizing raw data. Techniques include removing duplicates, handling missing values, and formatting data for analysis.
2. Formulas and Functions:
- Both platforms offer a wide range of built-in formulas and functions for performing calculations, aggregations, and statistical analyses on data.
3. Pivot Tables:
- Pivot tables are powerful tools for summarizing and analyzing large datasets. Users can arrange and analyze data dynamically by dragging and dropping fields.
4. Data Analysis Tools:
- Excel and Google Sheets include various data analysis tools such as regression analysis, goal seeking, and scenario analysis.
5. Sorting and Filtering:
- Sorting and filtering capabilities allow users to organize data in a meaningful way, making it easier to identify patterns and trends.
Dashboard Visualization in Excel and Google Sheets:
1. Charts and Graphs:
- Both platforms offer a variety of chart types, including bar charts, line charts, pie charts, scatter plots, and more. Users can create visually appealing charts to represent data.
2. Sparklines:
- Excel and Google Sheets support sparklines, which are small, inline charts that provide a visual representation of data trends within a single cell.
3. Conditional Formatting:
- Conditional formatting allows users to apply formatting rules based on the values in cells. This feature is useful for highlighting key data points.
4. Data Bars and Color Scales:
- Data bars and color scales provide visual indicators within cells, making it easier to interpret the magnitude of values.
5. Pivot Charts:
- Excel and Google Sheets allow users to create pivot charts that are linked to pivot tables, providing dynamic visualizations based on the underlying data.
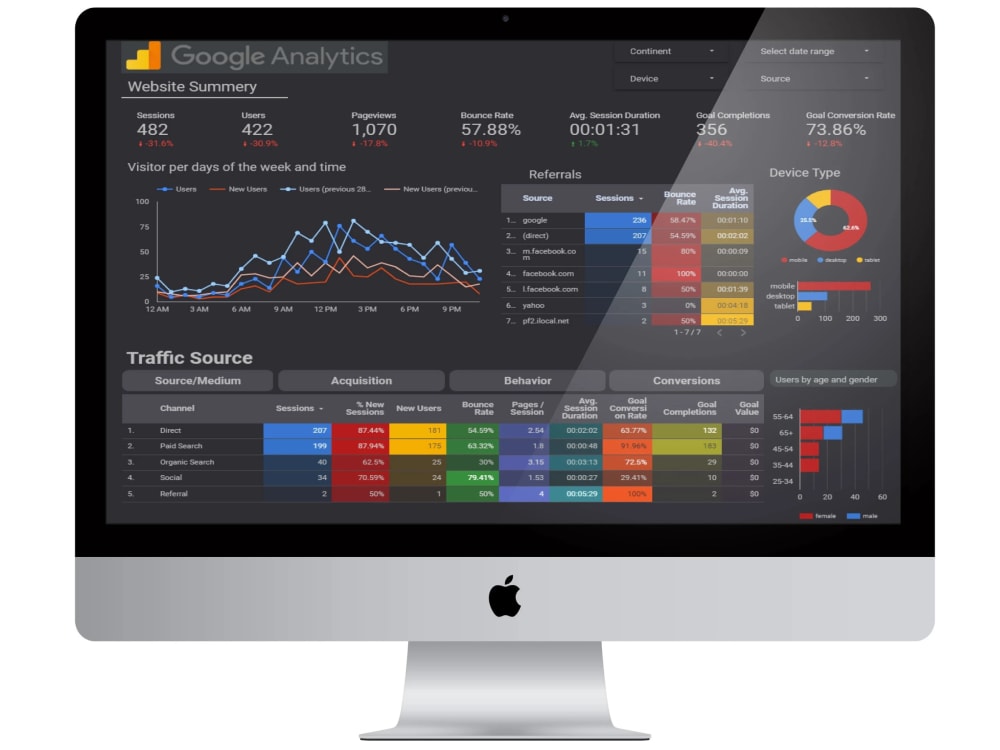
6. Interactive Dashboards:
- Users can create interactive dashboards by linking charts and graphs to form a cohesive visual representation of key metrics. Buttons, dropdowns, and other controls enhance interactivity.
7. Data Validation:
- Data validation tools help ensure that data entered into cells meets specific criteria, reducing errors in the dashboard.
8. Dynamic Charts:
- Dynamic charts in both platforms allow users to update visualizations automatically as underlying data changes, maintaining the relevance of the dashboard.
9. Google Sheets Add-Ons and Excel Add-Ins:
- Both platforms support add-ons and add-ins that extend their capabilities. Users can leverage these tools to enhance data analysis and visualization functionalities.


Joy –
Hiring this freelance data analysis and dashboard visualization expert was a wise investment for our business. His mastery of Excel and Google Sheets allowed for in-depth data analysis, and the dashboards they created were both functional and visually stunning. The freelancer’s ability to translate raw data into meaningful insights has had a positive impact on our business strategies.
Zainab –
Working with this freelance data analysis and dashboard visualization specialist was a pleasure. His expertise in both Excel and Google Sheets was remarkable. He took raw data and transformed it into actionable insights through clear and dynamic dashboards. The freelancer’s attention to detail and commitment to delivering a comprehensive analysis made our collaboration seamless.
Bello –
This freelance data analysis and dashboard visualization expert truly exceeded my expectations. His proficiency in Excel and Google Sheets was evident in the insightful data analysis they provided. The dashboards they created were not only visually appealing but also offered a clear and concise representation of our key metrics.
Maryam –
I am thoroughly impressed with the data analysis and dashboard visualization services provided by this freelancer. His proficiency in Excel and Google Sheets turned complex datasets into visually appealing and easy-to-understand dashboards. The freelancer’s analytical skills and attention to detail were evident throughout the project, resulting in a valuable resource for our decision-making process.